
What is Trade With Titans?
Trade With Titans (TWT) is a vibrant community of traders focused primarily on equity indices like the S&P 500 and Nasdaq-100. Our mission is to create a space where real-time learning and practical trading experience are the cornerstones of growth for every trader. We believe that time spent in the market, coupled with hands-on experience, is the most effective way to develop trading skills.
In TWT, our community leaders, known as Titans, are committed to offering real-time insights and trade ideas. This approach bridges the gap between theoretical education and practical trading applications, all while aiming to generate profits. Here’s what makes our community stand out:
Morning Live Trading Sessions
The highlight of TWT is our live trading sessions held every morning. From 9:30 AM to 11:30 AM, our experienced traders and community leaders share their insights live via voice chat. These sessions replicate the dynamic atmosphere of a trading floor, combining educational discussions with general banter and entertainment. This informal yet focused environment is designed to enhance learning and make trading an enjoyable experience.
Continuous Support and Updates
While our morning sessions are the focal point, support and updates from our team continue throughout the day. Members can expect timely updates and trade ideas in our text-based channels, ensuring you’re never out of the loop.
Preferred Trading Products
At TWT, we predominantly trade futures contracts such as ES/MES (S&P 500) and NQ/MNQ (Nasdaq-100). While these are our preferred products, our community also trades options on SPX, NDX, SPY, and QQQ, mainly for swing trades. This diverse approach allows members to explore various trading strategies and find what works best for them.
Additional Benefits
- Real-Time Learning: Engage in live trading sessions and learn directly from seasoned traders.
- Community Interaction: Join a supportive community where you can discuss trades, share ideas, and grow together.
- Proprietary Orderflow Algorithm: Access a powerful algorithmic bot designed to support your trading strategies.
- Educational Resources: Benefit from a wealth of educational materials and insights shared by our Titans. We host bi-weekly educational sessions where we provide market outlooks on larger timeframes, provide opportunities to learn more about our Titan’s trading strategies, and bring on guest-speakers that are experts in their specific domains,
Getting Started
Learn about futures, choosing the right broker, online 'proprietary' trading firms, and trading/charting platforms.
Sierra Chart Quick-Start Guide
Walkthrough on how to setup our recommended charting and trading platform.
Volume Profile and Depth of Market
An introduction to the two fundamental tools used by our Titan's and community members, with a practical trade example.
Trade With Titans Toolkit
Understand how our algorithm provides directional signals on S&P and Nasdaq futures.
Learn how to use our daily plan levels to make informed trading decisions.
Getting Started
To help you get started, we've put together a comprehensive guide covering everything you need to know to begin your trading journey with us.
Sign Up
Visit our storefront and join our discord. It’s quick and easy!
Introduce Yourself
Head over to the 'Introductions' channel and share a bit about yourself. We love to welcome new members personally.
What are Futures?
We’re going to skip the formal definition of a futures derivative contract and instead speak about the colloquial term that we reference in our community.
Futures let you make direct speculative trades on an asset. So, the same way that you can buy shares of SPY, you can buy “contracts” of futures. Here’s a simplified breakdown:
We prefer futures as they offer a straightforward way to leverage your trades, providing the benefits of leverage similar to options but without the complexity. This makes them a favorite among our community members, allowing for both strategic trading and easier risk management.
Leverage
A futures contract is inherently leveraged, which means you can control a large position with a relatively small amount of capital. For example:
- ES (S&P 500 Futures): Leveraged by 50
- NQ (Nasdaq-100 Futures): Leveraged by 20
Linear Pay-Off
Futures provide a linear pay-off, which means your profit or loss changes proportionally with the movement of the underlying asset. This is simpler compared to options, where the pay-off can be affected by various factors (known as the options Greeks).
This leverage allows for amplified gains and losses. If you are long at 4,000 on ES with 1 contract, and ES trades up to 4,001, you’re up one point - you’re up $50. Conversely, if ES trades down to 3,999, you’re down one point - and therefore down $50. The 'Micro' offering (MES/MNQ) is 1/10 the size of their counterpart, so $5 and $2 comparatively.
Choosing a Broker
A broker is the firm, company, or software that acts as the intermediary between you (the investor) and the exchange. Brokers facilitate the process of routing your trades to the exchange and are where you will deposit and withdraw your funds.
There are many different brokers available, each with their own policies, fees, restrictions, and features. Selecting the right broker depends on your trading needs and preferences.
Popular Brokers for Futures Trading
brokers commonly used for futures trading by our community
Popular Brokers for Options Trading
especially for beginners
Online 'Proprietary' Trading Firms
Recently, there has been a resurgence in online 'proprietary' trading firms offering individuals the ability to trade futures products with minimal start-up costs. These firms allow users to trade using 'sim' (simulated) accounts, with account sizes varying between $25,000 and $150,000. Instead of depositing a large sum of money, traders pay a fee to the provider, which can range from $10 to $1,000 depending on the account size.
Benefits
Minimal Start-Up Costs
These firms provide an affordable entry point for new traders, making it easier to start trading futures without a significant initial investment.
Reduced Risk
Trading with simulated accounts allows traders to familiarize themselves with futures trading without risking their own capital.
Expedited Account Setup
Setting up an account with these firms is typically faster and simpler compared to traditional brokerage accounts.
Drawbacks
Rules
While these services offer significant advantages, they also come with very strict trading rules. These rules can include daily loss limits, maximum drawdowns, and specific profit targets. Such constraints can be detrimental to a trader's learning and long-term success, as they may encourage risky behavior or stifle the development of effective trading strategies.
Limitations
It's essential for traders to weigh these pros and cons carefully. While online proprietary trading firms can provide a valuable learning experience and an affordable entry into futures trading, it's crucial to be aware of the potential limitations and ensure that your trading approach aligns with these constraints.
Trading and Charting Platforms
There are a wide variety of charting and trading platforms available, each with its own benefits and drawbacks. However, there are two platforms we particularly recommend for our community:

Sierra Chart is a comprehensive and powerful all-in-one platform that allows for the charting and trading of various products. It is tailored specifically for futures trading, making it the most popular platform used in our community.
Key features
Advanced Charting
Offers a wide range of chart types and customizable indicators.
Order Execution
Provides direct market access for efficient trade execution.
Customization
Highly customizable to suit individual trading styles and strategies.
Integration
Supports integration with multiple brokers and data feeds.
TradingView is a simple and intuitive charting platform, with the main benefit being its ease of use. It is also a popular platform used in our community. Key features include:
Key features
User-Friendly Interface
Easy to navigate, making it ideal for both beginners and experienced traders.
Cloud-Based
Access your charts and analysis from anywhere with an internet connection.
Comprehensive Tools
Offers a variety of chart types, indicators, and drawing tools.
Sierra Chart Quick-Start Guide
Sierra Chart is a comprehensive Trading and Charing platform that supports connectivity to multiple data providers and exchanges. The real-time market data feeds they provide are the closest retail can get to professional-grade data. They provide live and simulated trading environments, as well as manual and automated trading.
Most importantly, they provide real-time and historical charting with powerful analytics making it our recommended charting and trading platform. As this platform is so powerful, and offers significant customization capabilities, it can be a bit confusing at first. Worry not however, we will provide you with the chartbooks used by our Titan's, and guide you through the process of setting up your trading environment.
Requirements
There are a couple requirements to use the Sierra Chart platform and receive the discounted rates on their high quality real-time market data feeds.
✓ Supported Broker
To trade through the Sierra Chart platform, you will need to use a supported broker
Most online proprietary trading firms offer connectivity to popular trading platforms such as Sierra Chart. Typically, these firms use a simulated environment through Rithmic.
✓ Receiving Discount on Real-Time Market Data Feeds
Sierra Chart offers a significant discount on their real-time market data feeds for retail traders; however, you will need a funded account with one of their supported brokerages. This poses an issue for those not using a supported brokerage, or using an online proprietary trading firm.
Luckily, there's a workaround! You only need to login to a funded brokerage account once a month to maintain your discounted rates, so we suggest just creating an account with Interactive Brokers and loading a couple hundred dollars on it if needed.
Creating Your Sierra Chart Account
Once you have an account with a supported broker, we can begin setting up a Sierra Chart account with the necessary service packages and data feeds.
First, register an account with Sierra Chart and select the correct service package. Each service package includes different features provided by Sierra Chart. We highly recommend subscribing to 'Integrated Service Package 11'
Under "Account Management -> Activate Services" select one of the following:
- Integrated Service Package 11
- This will provide you the ability to connect to an external trading/data service so that you may route your trades through your broker and receive their data. In addition, it provides the capability to use footprint, volume profile and market profile charts. Fundamental features used extensively by community members and leaders.


Connecting Your Trading Account To Receive Market Data Discount
Before we go any further, you'll need to connect your trading to Sierra Chart.
First, install Sierra Chart to your desktop using this installer here.
Then, navigate to the Sierra Chart client and go to File -> Data Trade/Service Settings and select your brokerage. This is a straight forward process for Rithmic and CQG, however, you may need to use the Sierra Chart Teton Order Routing Service if using AMP futures, EdgeClear, IronBeam and others. InteractiveBrokers also has it's own process to connect to Sierra Chart. We've included helpful links below.
Additional information can be found here.


Activating Real-Time and Historical Market Data
The last step before we start preparing our trading charts and chartbooks is to subscribe to real-time and historical market data. At this point you should have a Sierra Chart account, activate Integrated Service Package 11 and have a trading account linked and verified.
Navigate to the 'Activate Services' webpage, confirm that your trading account has been linked and verified, then navigate to 'Denali Exchange Data Feed CME / CBOT / NYMEX / COMEX Exchanges (Optional)'. Complete the CME / CBOT / NYMEX / COMEX Exchange Agreements.
Lastly, navigate to 'Activate / Deactivate Denali Exchange Data Feed Exchanges [CME / CBOT / NYMEX / COMEX]' and activate the correct data feed. We recommend 'Full CME Group (CME, CBOT, COMEX, NYMEX) for non-professional Trading accounts', however, if you require Market Depth select the 'Full CME Group (CME, CBOT, COMEX, NYMEX) with Market Depth for non-professional Trading accounts'
Once activated, we're good-to-go!


Loading Charts and Chartbooks
Now the fun begins! In this section, we will be preparing your charts and trading setup so that you may view markets through the exact same lens as the leaders and other members in the TWT community.
The Trade With Titans Chartbook includes three charts:
To use this chartbook in Sierra Chart, you will need to navigate to it's directory and upload the TradeWithTitansChartbook.cht to the 'Data' subfolder (e.g., C:\SierraChart\Data\)
After the chartbook has been uploaded to the 'Data' subfolder, you may open Sierra Chart and open the chartbook (File->Open Chartbook)

Editing Charts in your Chartbook
After Sierra Chart is finished downloading all the historical data and updating your charts, our next step is to make any necessary revisions.
Finding Symbols
(required if broker uses different symbol codes)
Some brokers may have specific symbol codes for individual futures contacts. To update the correct symbol code and apply it your chart, navigate to File->Find Symbols and locate the intended contract. We will look for the S&P 500 Micro E-Mini September 2024 contract.


Editing Chart Symbols
To edit a chart's symbol, select the chart and navigate to 'Chart Settings' and update the symbol.
NOTE: to chart or display the E-Mini contract and have orders routed to the Micro E-Mini contract, simply update the 'Trade and Current Quote Symbol' field to the micro contract. In this case, we would update it to MESU24-CME.

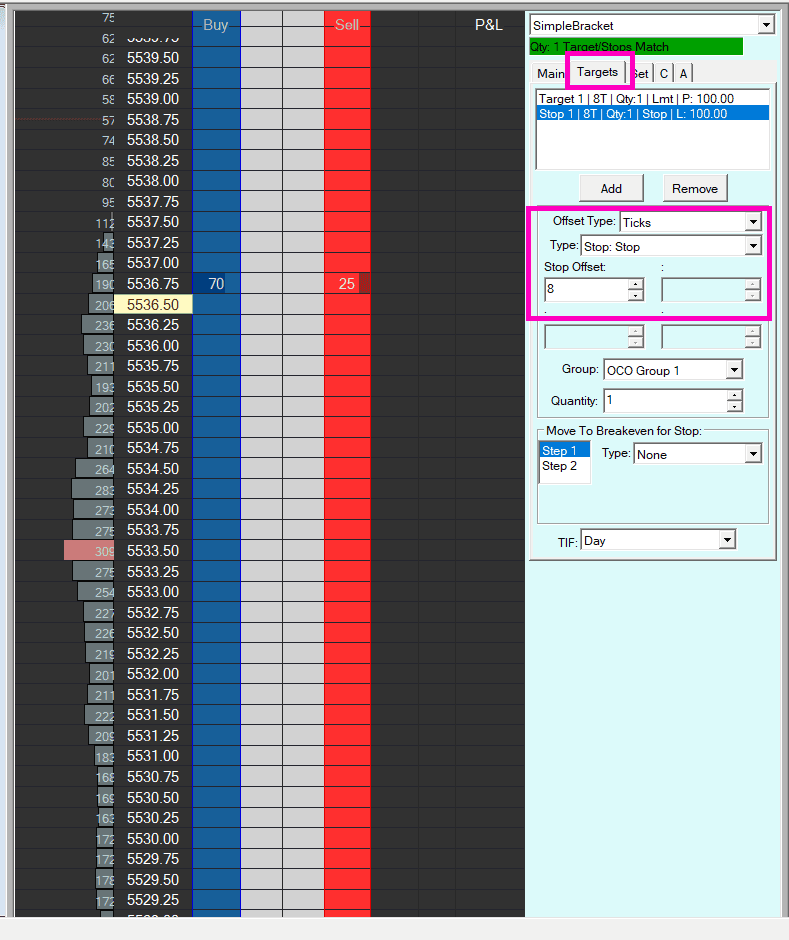
Creating Bracket Orders
Bracket orders allow you to automatically set Stop Loss and Take Profit orders when you enter a position. To create bracket order rules, navigate to the DOM and in the trading panel click 'Targets'.
From here, you may add or remove stop loss and take profit bracket orders. Keep in mind, it is denominated by ticks! Both S&P 500 and Nasdaq-100 futures are denominated in 0.25 tick sizes, meaning, 4 tickets is equal to 1 point. If you would like a 5 point stop, that would be 20 ticks.
For more info, visit this link.
Volume Profile and Depth of Market
To give you an idea as to what to expect in the Trade With Titans Community, and to familiarize you with our trading style, we have included two brief educational lessons introducing the concepts of Volume Profile and Depth of Market (DOM)
Volume Profile
Volume Profile in Practice
To illustrate a practical application of the concepts above, using the last trading session as of writing this (06/22/2024), we will look to the trading session of 06/21/2024. One of our Titan's, Usual Whale, led the room during the morning live session: selling 20,020 netting a +100 point gain in less than 20 minutes.


Usual Whale had identified the 5338 area as a level of interest due to the double distribution in the volume profile from the day prior, indicating a trend down. The overnight session had shown acceptance, with the entirety of it's volume trading in the bottom of the previous day's double distribution. Being one of his favorite setups, he knew he had the opportunity to sell the area of accumulation in that overnight session (high volume node and VWAP) for a continuation lower.
Ultimately, he had decided to execute this trade on NQ as it was weaker than ES, and entered the trade with a stop above 20,030 knowing the trade idea would be invalidated above that price level.

Depth of Market
Trade With Titans Toolkit
Orderflow Bot 3.5
Orderflow Bot 3.5 is a machine learning algorithm that sends informational alerts about unusual, usually directional order flow in the e-mini S&P 500 and Nasdaq 100 futures. It runs from 9:45 AM to 3:50 PM EST on most trading days.
The Bot was conceived based on the experiences of Strizzij and Set, who felt like they were repeatedly noticing the same patterns in their order flow analysis. Our goal was to automate the detection of some of these patterns, especially given a computer can often spot patterns much faster than a human.
The Bot’s alerts are not intended to be and should not be construed as a signal to take any action, including the buying and selling of any securities. Trading and investing is risky and can lead to losing money. Be sure to thoroughly read our disclaimer.

How We Use Orderflow Bot 3.5
In short, while the data we have indicates that the Bot has positive expectancy in many situations, we personally use the Bot to help confirm or add confluence to the conclusions of our own analysis. As the Bot is a self contained algorithm, it sometimes cannot pick up on context that is obvious to a human. We find the combination of the Bot’s alerts alongside our own strategies, with disciplined risk management, to be the most effective approach.
Days The Bot Does Not Run
Day of any US corporate holiday
(including “observed” holidays if the holiday itself falls on a weekend)
Day of an FOMC statement
Days that fall during index futures contract rollover periods
The Bot’s edge is not the same on all days. In particular, we’ve noticed that on days where there are a lot of price insensitive flows, its edge is diminished substantially.
We may also discretionarily choose not to run the Bot on certain days if we feel that it may be negatively impacted by the current market state.
Performance
This brings us to the topic of performance. Ultimately, the outcome of a trade taken at a Bot alert depends heavily on a variety of factors including the individual trader’s style, their risk tolerance, and the current market context. There are many examples of this:

Strizz often prefers to layer orders around a Bot alert and then trim and take profits as the trade works out in his favor. This approach has the advantage of 1) Avoiding a “front run” or “stop run” ruining the trade and 2) Securing profits even on relatively “smaller” magnitude market moves. However, the downsides include 1) Potentially adding into a losing trade and 2) Capturing less total profits on big trends.

Set often decides to start with smaller size on an initial entry after a Bot alert and then “add up” as the trade becomes more profitable, with more ambitious price targets. This approach has the advantage of 1) Minimizing size on losing trades and 2) Capturing more profit during larger market trends. However it can result in 1) Missing out on smaller magnitude winning trades and 2) Psychological stress from having a less optimal average price/entry.
We usually tend to widen our stop losses and lower our size when the market volatility is high, and narrow our stops and increase size when volatility is lower.
As an example, here is the Bot’s performance over 2 contracts, using a very simple fixed risk:reward ratio and taking every single trade. Note that the these results can potentially be improved by using a more refined trading strategy (e.g. all the very large trends captured by the Bot aren’t properly represented here), considering market context, and not naively entering on each alert.

Daily Plan
The Daily Plan consists of volatility-adjusted levels updated daily for E-Mini S&P 500, E-Mini Nasdaq-100 and select equities. Each level is distinctly categorized according to the expected market behavior.


The Daily Plan was developed to capitalize on the market's mean-reverting tendencies using options market dynamics, specifically implied and realized volatility. These levels are designed to help anticipate areas of market reversals and are formatted as follows:
Trend Up
Price is trending higher
At these levels, we anticipate price to get 'sticky' (i.e., trade sideways in a tight range) or slowly trend higher.
Resistance (Momentum)
This is viewed as the last opportunity for mean-reverting flows to step into the market
These trades require nuance, as historically, this level triggers significant upside.
Bull Pivot
One of the two primary pivot levels for the trading day
Above this level, we anticipate bullish price action
Bear Pivot
One of the two primary pivot levels for the trading day
Below this level, we anticipate bearish price action
Support
Similar to resistance, this is an opportunity for mean-reverting flows to step into the market
Price action below this level is largely determined by higher timeframe trends
Trend Down
Price is trending lower
In contrast to 'Trend Up', we anticipate significant volatility manifesting as a reversal in trend or continued downside
Integrating with Volume Profile
Our members find that the Daily Plan works well in conjunction with the volume profile. By assessing the distribution of volume between each level, mean-reversionary or trending price behavior becomes clearer. Using the shape of the volume profile, traders can better predict price movements and optimize their strategies.
Backtesting Insights
Best Mean-Reversion Trades
These typically occur at the bull pivot (short), bear pivot (long), and support (long). These trades have a high win-rate and good risk/reward.
Most-Convex Trade
This typically occurs at resistance/momentum (short). Although it has a lower win-rate, it offers a great risk/reward.
Best Trend-Following Trade
Buying above momentum is most effective when significant volume and/or time has occurred above this level.
By following the Daily Plan and integrating it with the volume profile, our members can effectively navigate the markets, leveraging both mean-reverting and trend-following strategies to optimize their trading outcomes.
Volatility Bot (Beta)
Ever since their release, our daily plan levels were an even bigger hit than expected. Especially when used in confluence with our orderflow analysis, their ability to not only help pinpoint potential mean reverting opportunities, but also provide a framework to identify strong market trends, has provided the community a versatile tool to add to their arsenal.
We decided to take the underlying principles behind our daily plan levels, and turn them into a intraday reversal indicator. And thus was born the Vol Bot!
How It Works
As its name suggests, the Vol Bot relies on a sophisticated analysis of options volatility. Options, especially on highly liquid instruments, are one of the most efficient markets when it comes to pricing the ranges an instrument might trade within a certain probability. Market makers and other institutions use this information to contextualize the market, hedge risk, and power their models.
We’ve worked through several years worth of institutional grade options data to extract these probabilistic ranges and build sophisticated models on top of them to create a phenomenal bot that we consistently leverage for our trading.
As a bonus, we’ve managed to port the Vol Bot into TradingView, so it’s easily accessible and fits seamlessly into your trading ecosystem.

Interpreting the Vol Bot is pretty simple. The pink dots indicate different degrees of bearish signals and the blue dots different degrees of bullish signals. We find that the weakest signals (the most transparent, and referred to as 'small deviation') work best when they price reverses right away, while the strongest signals (the deep-colored triangles, referred to as 'significant deviations') work the best overall, however, they typically are what we refer to as a 'slow-boat turn' in price.
You can pick-and-choose what signals you want to see under the settings of the indicator.
What Instruments Does It Run On
Currently, the Vol Bot runs on the S&P and Nasdaq futures during Regular Trading Hours (RTH). Premium members have access to the S&P Vol Bot, and Lifetime members have access to both the S&P and Nasdaq versions.
We’re actively working on adding even more instruments to the Vol Bot, so stay tuned!
How Well Does It Work
The VolBot isn’t a trading strategy, so the exact performance you may experience with it will vary based on a number of factors such as your risk tolerance and trading plan. We personally use it in confluence with our other trading tools and analysis.
However, we have backtested the performance of the VolBot. Below is a summary of the results for a backtest run from 2023-09-01 to 2024-07-16 using a very naive trading strategy and TradingView's built-in backtesting engine..
Overall, the Vol Bot achieved a win rate of 55% with a profit factor of 1.4 Not too shabby!

Differences From The Orderflow Bot
While there’s a minor amount of overlap between the Orderflow Bot and the Vol Bot, the Orderflow Bot primarily leverages data from the index futures market. On the other hand, the Vol Bot’s main data source comes from the index options market.
We personally find that using both bots in conjunction has been extremely helpful for our trading.
How To Access It
Accessing the Vol Bot is super easy! Just log into your Whop account using your Discord, click on your TWT membership, and claim the TradingView indicator. You should be able to add it to your own TradingView profile in just a few clicks.
If you’re having any trouble, please contact us via email or open a support ticket in the Discord server.
Putting It All Together: Your Launchpad to Trading Success
You've come a long way. From setting up your broker account and trading platform to developing a statistical edge, you've laid the groundwork for your trading journey. Now, it's time to bring all these pieces together and prepare for liftoff. At Trade With Titans, we believe that two elements are crucial for your success: a solid risk management framework and a comprehensive trading journal.
Risk Management: Your Trading Lifeline
Risk management isn't just important – it's the bedrock of successful trading. In fact, we consider it even more crucial than having a statistical edge. Why? Because proper risk management keeps you in the game long enough for your edge to play out.
Our risk management framework is designed to protect your capital and maximize your potential for long-term success. It covers everything from position sizing and stop-loss strategies to managing your overall portfolio risk. By following this framework, you'll be able to weather the inevitable storms of the market and come out stronger on the other side.
Trading Journal: Your Personal Trading Coach
A well-maintained trading journal is like having a personal coach who knows your every move in the market. It's a powerful tool for self-reflection, analysis, and improvement.
Our trading journal template is inspired by the best practices of established proprietary trading firms. We've taken the most effective elements from the journals used by junior traders on the actual trading floor and adapted them for our community. This journal will help you track your progress, identify patterns in your trading, and continuously refine your strategy.
By combining our risk management framework with diligent journaling, you're not just putting the pieces together – you're creating a robust, professional-grade trading system. Remember, successful trading is not about making one big score; it's about consistent performance over time. These tools will help you achieve that consistency and set you on the path to trading mastery.
Ready to take your trading to the next level? Dive into our risk management framework and start using our trading journal today. Your future self will thank you!